What are Bar Graphs?
It is the rectangular graph based on columns that express total number of observations of each category. We use bar graph for data plotting. We can also use it in the form of horizontal bars, vertical columns, stacked and comparative bars. It allows us to express different information and the comparable values in bar categories. We can also use to display our financial analysis. Various experts use vertical bar graph in the form of stock volume. We can also use bar graph to express any data in different and highly visualize way. It is y and x axis help us to show different categories of data. There will be no difficulty in expressing information in vertical and horizontal columns. There is a combination of distinct labeled variables for comparative purposes. Bar graphs help us in recognizing the total amount of divisions and finding the rational information fast. There are two vertical and horizontal axis that we usually denote them by x and y axis. When we have to show the data in comparison, we will display it by increasing and decreasing the length of the graph. For example, how much profit a company has earned within a year. Many businesses use it to track their cash flow performance and earnings according to each share.
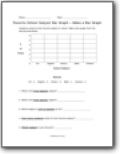
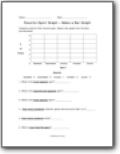
Favorite Colors Bar Graph
Students voted on their favorite color. Make a bar graph from the data provide and then answer questions based on it.

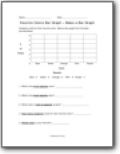
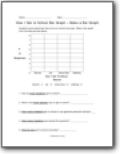
Favorite Food - Horizontal Bar Graph
Students voted on their favorite food. Make a bar graph from the data and answer questions based on it.

Favorite Footwear - Horizontal Bar Graph
Same deal! Students vote on their favorite kind of footwear, not brands.
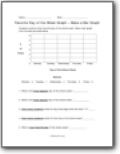
Favorite Day of the Week
Time to analyze another voting setup this time on which of the seven days is best.
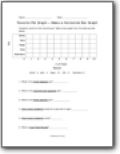

How I Get to School
We compare the forms of transportation that students take to get to school each day.